
Q4 2025
This note summarises the Fund's results for the fourth quarter and full year of 2025, and the main ideas shaping our positioning into 2026.
Performance
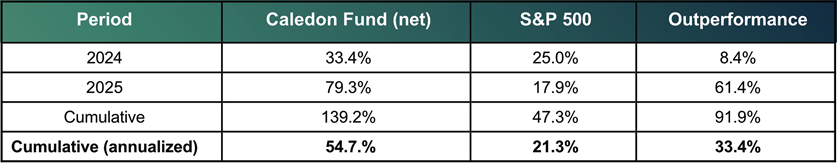
The Caledon Fund's unaudited net return for the fourth quarter of 2025 was -1.1%, taking the full-year return to 79.3% (USD, net of fees). Over the same periods, the S&P 500 Index returned 2.7% and 17.9%, respectively. Since inception on 1 January 2024, the Fund has delivered a net cumulative return of 139.2%, or 54.7% on an annualised basis.

Portfolio Highlights
At year-end, our three largest positions – Siemens Energy (6.8%), IREN (6.5%), and Eos Energy (6.4%) – represented 19.7% of the Fund. Next Vision Systems, Kraken Robotics and Siemens Energy were the top contributors to Q4 performance, while Power Solutions International and Nebius were the largest detractors. We initiated a new position in Terravest Industries, a leader in energy storage fabrication, to capitalise on its exposure to North American reshoring trends.
The Fund's 2025 result is uncommon. Returns of this magnitude typically occur when several long-standing structural forces simultaneously reinforce one another. In most market environments, a return of this scale would be expected to accrue over a more extended period.
Valuations after a strong rerating
Following a year of significant gains, we reassessed portfolio valuations with a simple test: do the underlying growth prospects still justify the prices being paid? On that measure, the answer remains yes. A single portfolio multiple is not especially informative, given the mix of mature compounders and earlier-stage businesses still scaling towards profitability. On the latest available data (Q3 2025), trailing twelve-month revenue and operating-income growth across the portfolio exceeded 50%, materially ahead of the broader market.
That operational momentum is not always captured in external models. In fast‑moving, capital‑intensive sectors, analyst forecasts often assume mean reversion: growth is faded beyond a standard two‑year window, and margins are nudged back toward historical norms. We think this approach understates the duration of the energy‑infrastructure build‑out now underway. The result is that reported multiples can look demanding even as companies' pricing power at key choke points is strengthening.
Nvidia illustrates the point. When we launched the Fund, forecasts assumed growth would normalise quickly, with revenue growth expected to fall below 20% by 2026. Outcomes were markedly different: revenue growth in CY2024 and CY2025 was approximately 114% and 64%, respectively. In hindsight, we initiated our Nvidia position in January 2024 at roughly 10x CY2025 earnings. Current forecasts imply revenue growth of 50%, 27% and 8% over the next three years, placing the shares on about 19x expected CY2027 earnings – leaving meaningful upside if growth endures longer than those assumptions imply.
AI as an energy demand shock
The engine behind Nvidia's growth — artificial intelligence — is no longer confined to the digital world. It is increasingly a power and infrastructure problem, with data center buildouts translating directly into incremental electricity demand, particularly in the United States. Projections indicate U.S. data center electricity demand could double by 2030, amplifying these trends. Investment decisions across data centers, grid upgrades and on-site generation are therefore being shaped by computational needs as much as by decarbonisation policy.
AI infrastructure was not a founding premise of the Fund. Its emergence has reinforced rather than replaced themes already embedded in the portfolio: electrification, industrial reshoring, grid hardening and automation. These drivers predate the current AI cycle, and we judge they would persist even if its pace moderated. America would still need to upgrade its electrical grid, industry would still be incentivised to reshore critical capacity, and automation is likely to remain central to any new wave of industrial capex.
Scale, learning and advantage
A recurring feature of these industries is the power of scale – a dynamic we frame through Wright's Law. The principle observes that unit costs tend to fall as cumulative production rises, creating a compounding advantage for incumbents. Learning effects and process optimisation therefore tend to favour early leaders, often decisively.
This has two implications for our work. First, it helps explain the structural dominance of Chinese manufacturers in several categories — and why that scale advantage has provoked a defensive response in developed markets through trade barriers and reshoring. Second, within developed markets, it strengthens the case for backing early leaders in emerging segments, where capital intensity and execution complexity widen the gap between leaders and followers as volumes rise.
Evidence from recent industrial history
The U.S. electric vehicle (EV) market offers a clear illustration of the barriers created by early-mover advantage. Tesla's initial scale unlocked rapid cost efficiencies that legacy competitors have struggled to replicate. On 8 January 2026, GM disclosed $6bn of EV-related charges as it reassessed its EV capacity and footprint, following a $1.6bn EV impairment charge in Q3 2025 and its decision in December 2024 to end Cruise's robotaxi development. Ford, similarly, announced $19.5bn of EV-related charges in mid-December 2025, effectively resetting its earlier all-electric ambitions.
In our view, these retrenchments are not simply responses to cyclical demand softness or shifting federal incentives. They reflect the difficulty of closing a large manufacturing and cost gap once an industry leader has moved far down the learning curve.
What this means for the portfolio
Within the portfolio, we see similar learning-curve advantages in companies such as Bloom Energy and Eos Energy. Both entered their markets early, built manufacturing and field experience over multiple cycles, and are now scaling volumes while improving unit economics. As these technologies move into mission-critical energy applications, customers also tend to prefer proven suppliers, reinforcing incumbents' advantage.
Bloom reached a notable inflection point in early January 2026 when AEP exercised its option for 900MW of baseload fuel-cell capacity. This $2.65bn order represents a 9x expansion from the 2024 pilot and meaningfully advances Bloom's progression from pilot deployments toward utility‑scale infrastructure.
In an environment where "time to power" has become a primary competitive advantage, the main risk for several companies in our portfolio is not demand, but execution: scaling manufacturing and field services quickly enough to convert an unprecedented backlog into delivered capacity.
Outlook for 2026 and beyond
A repeat of 2025's headline return would be neither typical nor expected. More important is that the portfolio remains positioned in businesses with durable competitive advantages, long reinvestment runways and exposure to persistent shifts in energy demand. We continue to find compelling new opportunities within our universe and reduced cash during the quarter to fund higher-conviction positions. In our view, the current environment offers an attractive entry point for investors with a long-term horizon.
As always, we thank you for your continued trust and partnership. We value your insights – please reach out with questions or feedback.